In-depth analysis of recent data suggests a high likelihood of Hikaru Nakamura achieving a 55-game winning streak in online blitz, based on thousands of his games played this year (and even more likely given that Hikaru just crossed 35,000 blitz games mark on Chess.com alone). Similarly, longest streaks by Magnus Carlsen (32 wins), Nihal Sarin (22 wins), and Daniel Naroditsky (33 wins) align with statistical expectations. The occurrence of both short (10+ wins) and long (15+ wins) streaks among these elite players is also found to be probable and not out of the ordinary. A simple explanation of Hikaru’s performance is that he plays an enormous number of games online, is highly skilled and (on average) has much weaker opponents than his peers (moreover, he specifically mentions cherry-picking opponents in order to score many points and create good content).
Update: Chess.com team has published a statement the next day reinforcing that they do not think long win streaks and individual performances of Hikaru Nakamura are suspicious and hint at the possibility of cheating.
We have confirmed these results with external statisticians, including a professor of statistics at a top-10 university.
Unfortunately, they have not shared any calculations and analysis. I would be very interested to see the methods and tools that were used and compare them to mine.
I’ve conducted basic analysis using Elo win probability estimations and Monte-Carlo simulation to estimate the likelihood of Hikaru Nakamura (and his peers) achieving long winning streaks, as recently highlighted by Vladimir Kramnik. For results and calculations, see Monte-Carlo simulation tables and conclusion below.
This post does not aim to determine whether Hikaru Nakamura or other players have engaged in any form cheating. Instead, my goal is to critically examine historical data from Chess.com games, focusing on the probability of long win streaks and exceptional performances. Even though the tools I use are reasonably robust, the preliminary analysis studies significant outliers, both in terms of the players and their performances. It also has some limitations and uses assumptions which are explained in detail.
My analysis does not require extensive computation and anyone interested can run the code within seconds on a most computers. All graphs and calculations are produced by these two scripts run with different parameters that I describe in the post. I hope to address some of these limitations in a consequent study which I want to publish soon.
In addition, this post does not consider and study the “hot hand” effect in detail (a belief that a player who has just won is more likely to win again and generate a streak). The “hot hand” fallacy is extensively studied in statistics: e.g. here’s an interesting post and a paper (from Econometrica, one of the top journals in Statistics and Economics). The research suggests that “hot hand” phenomenon exists despite prevalent beliefs that were dominant for many decades in Statistics.
Prelude§
Cheating is a huge problem in modern chess and it has been extensively discussed a lot in the last couple of years. Among many other voices, Vladimir Kramnik (14th World Chess Champion) frequents Levitov Chess YouTube channel and shares his views on the topic. He recently implied that Hikaru Nakamura, a renowned chess player, known for his exceptional skills in online blitz and streaming presence, might be cheating and asked Chess.com to investigate the case. The main finding that he has presented so far is that Nakamura has exceptionally long winning streaks against skilled opponents. This has sparked numerous discussions online and attracted a lot of interest from the chess community.
In his recent video Kramnik points out the following findings:
| Avg opponent rating | Results | Performance rating |
|---|---|---|
| 2950 | 45.5 / 46 | 3627 |
| 2912 | 34.5 / 35 | 3589 |
| 2737 | 55 / 55 | ∞ |
| 2949 | 46 / 48 | 3450 |
| 2792 | 47.5 / 48 | 3469 |
Vladimir believes that this performance is unusual and warrants a thorough investigation by Chess.com, although he explicitly mentions that he does not accuse Hikaru Nakamura of cheating.
As someone with a background in software engineering, data science, and mathematics, and a passion for chess, I’m interested in exploring Vladimir Kramnik’s recent statements. My aim is to sift through the data and see if there’s substance to these claims.
Looking into data§
My goal is to answer a relatively simple question: how statistically probable is it for someone rated as high as Hikaru in online chess to have the win streaks and high performances like the one mentioned in Vladimir Kramnik’s table.
Luckily, I can easily get plenty of data with online chess games and study it. Chess.com provides Published-Data API that I can use to gather more data and look at more aggregated statistics. Monthly archives endpoints offer a way to collect data on any player.
The dataset I have collected is as follows:
- Games are rated
- Time control is 3+0 blitz games: Hikaru goes into detail on why blitz with and without increment are very different in a recent video and shouldn’t be compared directly
- Games are played between
2023-09-26and2023-11-26(60 days period that is consistent with Kramnik’s analysis) - Played in the standard chess format (as opposed to Fischer Random Chess)
Here are my findings:
- Hikaru has played a total of 600 games in the last couple of months
- Hikaru won 518 of these games
- Hikaru drew 26 of these games
- Hikaru scored 531 out 600 points in total or 88.5% of total points
- Hikaru’s average rating was 3248.42
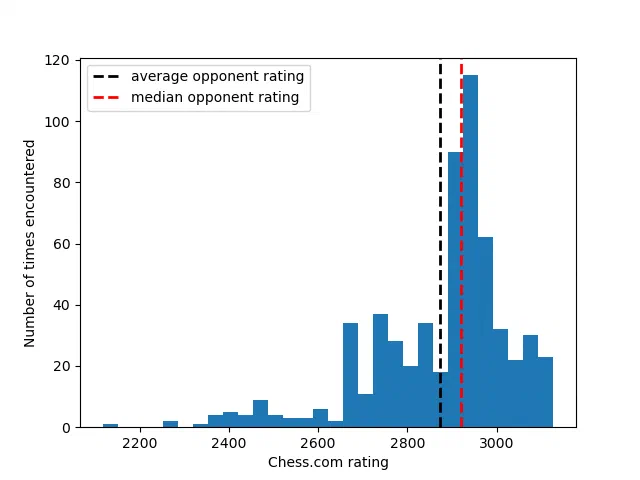
- The average opponent rating is 2873.43, median opponent rating is 2919.5
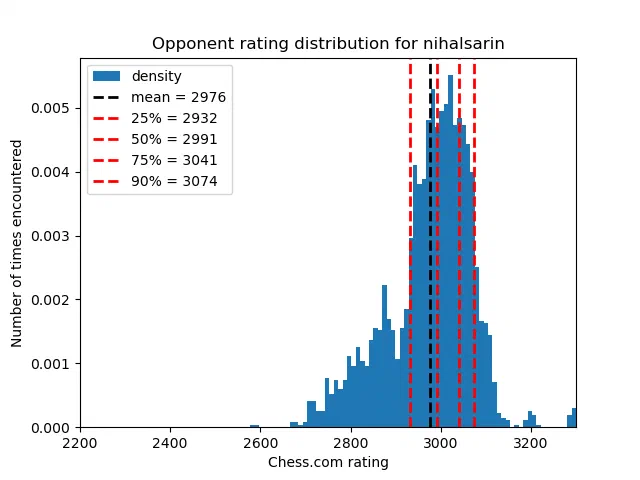
Let’s look at Hikaru’s opponents rating distribution:
Here are top 6 win streaks:
| Length | Avg opponent rating | Starting rating | First game |
|---|---|---|---|
| 55 | 2736.64 | 3176 | https://www.chess.com/game/live/89602740099 |
| 45 | 2772.89 | 3231 | https://www.chess.com/game/live/94493554773 |
| 35 | 2864.83 | 3226 | https://www.chess.com/game/live/89994571321 |
| 34 | 2744.71 | 3222 | https://www.chess.com/game/live/90353334085 |
| 28 | 2930.96 | 3287 | https://www.chess.com/game/live/93637696397 |
| 26 | 2958.46 | 3256 | https://www.chess.com/game/live/93912033813 |
These streaks are quite impressive, and I think I have found the streak that Vladimir Kramnik has mentioned in his video! The longest win streak does feature 2736.64 average opponent rating, which is exactly 2737 after rounding up. It looks like I’m using a similar methodology so far.
Another thing I wanted to consider is Hikaru’s starting rating. The ratings often vary for players and can go up and down by 200-300 points depending on mood, fatigue, tilt and other factors. I decided to store Hikaru’s rating at the start of the streak as a simple snapshot of his shape in that particular time frame.
Looking at other players§
Hikaru mentioned the concept of “farming” in his recent video in response to the winning streak data found by Kramnik. “Farming” is beating the opponent consistently to “create content” and gain rating. Hikaru claims that he and Daniel Narodisky are particularly strong in winning against lower-ranked opponents many times in a row and that statistics would be different for Magnus Carlsen or Fabiano Caruana.
Let’s take top 5 players from Chess.com blitz leaderboard from today:
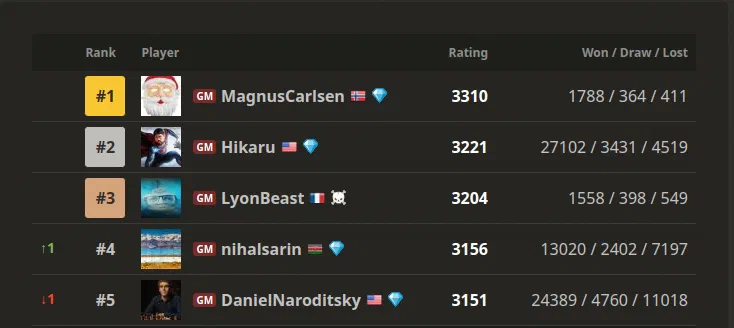
Hikaru Nakamura and Daniel Narodistky have by far most games, which is expected since both of them are streaming a lot and play online almost exclusively (with the exception of Hikaru recently having awesome live classical performances).
MVL only played 94 games in 3+0 format this year, so I won’t use his data for calculations.
Let’s look at some statistics for all these players for the year of 2023 (from 2023-01-01 to 2023-11-28).
N.B. I decided to use this year instead of lifetime statistics in order to make the calculations comparable between players. Magnus Carlsen didn’t play much on Chess.com until the Magnus Group merger and has only started playing actively recently (e.g. API call for games of July 2022 and most of the last year returns no games at all). Of course, if I have considered lifetime statistics of each player, then the results would be different. Additionally, there is a prevalent belief that ratings were on a different scale and the activity was an order of magnitude lower before the online chess boom in 2020. Therefore, even if I want to consider more data, I would probably only check last few years.
| Statistics | Carlsen | Nakamura | Sarin | Naroditsky |
|---|---|---|---|---|
| Games | 908 | 3032 | 2767 | 5123 |
| Points | 716.5 | 2558.5 | 1970.5 | 3964.0 |
| Scored of total | 78.9% | 84.38% | 71.9% | 77.3% |
| Avg rating | 3227.60 | 3216.22 | 3142.38 | 3130.88 |
| Avg opponent | 2984.50 | 2897.95 | 2976.46 | 2901.46 |
| 10+ streaks | 15 | 79 | 23 | 62 |
| 15+ streaks | 3 | 35 | 3 | 21 |
| 20+ streaks | 1 | 17 | 1 | 6 |
| Longest streak | 32 | 55 | 22 | 33 |
These statistics do look surprising at the first glance, but let’s look deeper into the data. As Hikaru mentioned, I think it’s a fair assumption that Narodistky is better comparison than Carlsen, Sarin and other players. This is because Daniel is an incredibly strong player himself and has similar goals to create content through streams and videos. Long win streaks are the content in many cases. For example, when I looked at the distribution of win streaks, there is a clear spike around 10 wins, which is unsurprising because this is called “adoption” in online chess and usually means that the player who scored 10-0 on their opponent dominated the match. Naroditsky also excels in short time controls without an increment.
Another interesting observation is that Carlsen and Sarin are nowhere close to both Nakamura and Naroditsky in terms of win streaks count. Carlsen has played much less, but Sarin played almost as much as Nakamura. However, it’s worth noting that an average opponent of Sarin is almost 100 rating points higher than for Nakamura. That, coupled with the fact that Sarin’s average rating is 70 points lower than Nakamura’s probably explains a lot. In that regard, Naroditsky is again very close to Hikaru in terms of average opponent, even though his average rating is also 86 points lower than Nakamura’s.
Looking at each player’s opposition§
It is clear that on average, Hikaru plays against weaker opposition than everyone else in the list. But how different is each player’s opposition?
First, what are the average rating gaps between average rating of the player and their opposition?
| Player | Average rating gap |
|---|---|
| Carlsen | 243 |
| Nakamura | 318.3 |
| Sarin | 166 |
| Naroditsky | 229.4 |
Again, Hikaru is in the clear first in terms of playing much weaker opposition. If Naroditsky himself would be rated higher, then the gap would be similar to Nakamura’s, so again it makes much sense to compare Nakamura and Naroditsky here. Sarin also plays a lot, but it looks like he mostly plays against very high-rated opponents and is likely mostly interested in training rather than playing for the sake of rating and creating content.
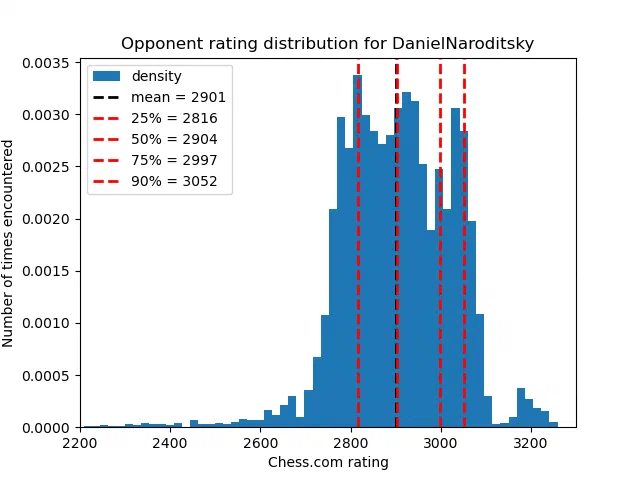
In addition to averages, let’s also look at the quantiles of each player’s opponents:
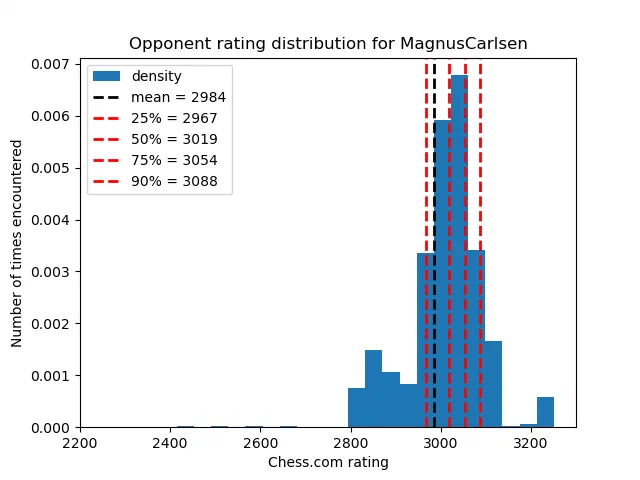
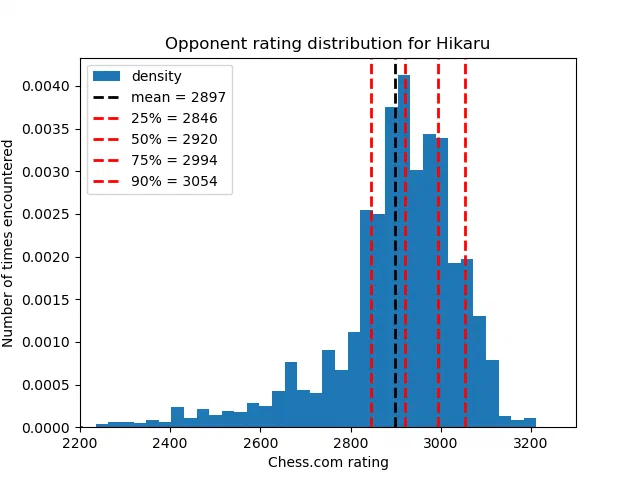
| Quantile | Carlsen | Nakamura | Sarin | Naroditsky |
|---|---|---|---|---|
| 25% | 2967 | 2846 | 2932 | 2816 |
| 50% | 3019 | 2920 | 2991 | 2904 |
| 75% | 3054 | 2994 | 3041 | 2997 |
| 90% | 3088 | 3054 | 3074 | 3052 |
Again, the statistics for Nakamura and Naroditsky are very similar here. Now that we see this data, it’s much easier to understand why Hikaru has these long win streaks:
- Hikaru plays a lot of games, so the sample size is large
- Hikaru is rated very highly, similarly to Carlsen
- Hikaru plays against much weaker opposition (on average) than his peers, which is similar to Daniel Naroditsky, but then again he is ranked much higher
It might be easier to look at the rating distributions visually:
Now, let’s get to figuring out the probability of achieving the streaks we found.
Analysis§
My main question is: what would be a probability of Hikaru having these very long winning streaks against opponents of the rating groups that I found?
Let’s discuss some limitations: we will consider each opponnet’s win probability in each game to be independent of adjacent games. This is not strictly true in real life: factors such as fatigue, tilt, time of day, and many others, certainly have impact.
I will also consider that Hikaru’s rating (and his opponents’ ratings) is “fair”, i.e. he has not cheated while achieving it. He is a top-2 ranked blitz player in the world and top-3 classical (according to today’s 2700chess leaderboard).
I will use Monte-Carlo simulation to simulate a large number of games being played between each player and his opponents and check how often we find similar win streak patterns. The key here is knowing an approximate probability of each game outcome. We can use win probability formula based on players Elo rating or a machine learning model. This approach is similar to one used on Pawnalyze.
Using Elo to estimate win probabilities§
Elo is a good starting model, because it’s simple, is studied well and has been long applied to chess. Chess.com uses Glicko, but it is also a crude approximation when it comes to win probabilities, so we’ll stick with the simpler Elo system. It has, however, a number of drawbacks.
A common issue with Elo system is that it doesn’t take into account White’s first move advantage (which is not good, but we’re mostly considering the win probabilities on average) and it also doesn’t work very well with large Elo differences.
Also, constants in probability formulas are some widely used ones and they are best suited for FIDE classical ratings, which have a slightly different range (with the top players never getting above 2900 whereas on Chess.com Hikaru and Magnus Carlsen have achieved a rating over 3300). Blitz and classical are quite different, too.
Another issue is that Elo is known to work poorly when the rating gaps are large (which is the case most of the time when someone rated online as high as Hikaru or Magnus plays blitz).
For Elo, we can use the same formulas from Wismuth Elo calculator (Pawnalyze post also mentions these formulas as a decent starting point):
def expected_score(elo_difference):
  return scipy.special.erfc(-elo_difference / ((2000.0 / 7) * np.sqrt(2))) / 2
There “full” formula that takes into account draws in chess (Note 7 on Wismuth) does not give good results for our rating ranges and is not reliable. Also, draws are very common in high-level classical chess. In fact, draws are often the default result of these games. In online blitz without an increment that is not the case, because of flagging. The difference in “expected score” and adjusted probabilities is quite large. For example, in case of Hikaru’s 55-win streak he started with a rating of 3176 against average opponents having 2736. The expected score (or “simple win probability”) is 93.7% while the adjusted probability is 70% with the draw probability of… 47%! That doesn’t add up because of FIDE constants and different rating ranges.
I think this is a critical observation, because it heavily influences the resulting probability. We will consider the expected score to be an overly optimistic win probability for the sake of simplicity.
And here we can also see that draws are much less likely in faster time controls:
| Time control | Carlsen | Nakamura | Sarin | Naroditsky |
|---|---|---|---|---|
| 1+0 | 11.2% | 6.9% | 7.6% | 8.3% |
| 3+0 | 11.5% | 7.8% | 11.4% | 13.5% |
| 3+1 | 14.9% | 13.8% | 12.3% | 23.1% |
Note: I could probably adjust win probabilities using sampled draw probabilities
since expected_score = win_probability + draw_probability / 2.
Even when the difference is just a second of increment, for professional chess players that is enough to make a huge difference.
Let’s take a look at the projected average win probabilities of each player throughout the year.
| Statistics | Carlsen | Nakamura | Sarin | Naroditsky |
|---|---|---|---|---|
| Avg rating | 3227.60 | 3216.22 | 3142.38 | 3130.88 |
| Avg opponent | 2984.50 | 2897.95 | 2976.46 | 2901.46 |
| Win probability | 80.2% | 86.7% | 71.9% | 78.9% |
Now let’s turn to each player’s longest winning streak:
| Statistics | Carlsen | Nakamura | Sarin | Naroditsky |
|---|---|---|---|---|
| Streak length | 32 | 55 | 22 | 33 |
| Start rating | 3162 | 3176 | 3148 | 3075 |
| Avg opponent | 2884 | 2736 | 2906 | 2819 |
| Win probability | 83% | 93% | 80% | 81.4% |
There’s a clear pattern here: the opposition is way weaker than the average opposition of each player. As a result, win probability is significantly higher.
Monte-Carlo simulations§
Let’s spin up Monte-Carlo simulations and finally see if the win streaks we found make sense!
The simulation I use is quite basic, as it essentially assumes:
- Each game is independent (which is certainly not true: I would imagine an opponent who lost a number of games to be demoralized)
- Each player maintaining the same rating throughout all games (average player rating)
- All opponents having the same rating (average opponent rating): that is also certainly not true. For example, while Hikaru Nakamura’s average opponent rating throughout the year is 2897.95, the historic 55-game win streak was scored against opponents of 2736 average rating. That is over 150 points difference!
Probability of scoring multiple short and long win streaks§
To understand what parameters to use for each simulation, let’s take a look at previous section’s table again.
| Statistics | Carlsen | Nakamura | Sarin | Naroditsky |
|---|---|---|---|---|
| Games | 908 | 3032 | 2767 | 5123 |
| 10+ streaks | 15 | 79 | 23 | 62 |
| 15+ streaks | 3 | 35 | 3 | 21 |
| 20+ streaks | 1 | 17 | 1 | 6 |
| Avg win probability | 80.2% | 86.7% | 71.9% | 78.9% |
In the table above, the average win probability is the one for the entire year.
I will run simulations and estimate probability of each player having at least as many streaks of given length as they have scored in real life over the past year.
So, for each simulation the parameters are:
- Number of games: played throughout the year
- Streak cutoff: 10, 15 or 20
- Minimum number of streaks: streaks that the player has scored throughout the year (table above)
- Win probability: average win probability (table above)
| Probability of | Carlsen | Nakamura | Sarin | Naroditsky |
|---|---|---|---|---|
| 10+ streaks | 94.6% | 99.9% | 90.6% | 100% |
| 15+ streaks | 97% | 99.5% | 91.8% | 98.3% |
| 20+ streaks | 89% | 95.5% | 65.3% | 91.5% |
Because streaks of 20+ wins are such an outlier and were scored against weaker field, not the average field of opponents each player has faced, the probability drops noticeably. That is expected.
Other than that, it looks like the win streaks we have observed are completely normal and very likely. Also, Nakamura’s “fighting” style certainly yields great results.
Probability of scoring the single longest win streak§
Now, let’s turn back to the question of whether the longest win streak is probable or not for each player.
| Statistics | Carlsen | Nakamura | Sarin | Naroditsky |
|---|---|---|---|---|
| Games | 908 | 3032 | 2767 | 5123 |
| Win probability | 83% | 93% | 80% | 81.4% |
| Longest streak | 32 | 55 | 22 | 33 |
In this table, the win probability is the one calculated against a weaker field of players who have been defeated in the longest win streak of each player. We will “assume” that each player has been playing against this weaker field the whole year for simplicity.
Let’s calculate probability of scoring the longest winning streak for each player:
| Probability of | Carlsen | Nakamura | Sarin | Naroditsky |
|---|---|---|---|---|
| Longest streak | 32.3% | 98.4% | 98.5% | 65.6% |
These results are more interesting. I certainly did not expect Carlsen’s probability of getting a win streak of 32+ games to be this low given relatively high win probability that he has, but also Carlsen is the one who played a least number of games this year on Chess.com. I’m pretty sure he plays a lot on Lichess and he is still the best player in the world, so I think the “Magnus factor” (among many others) has a huge influence.
Conclusion§
My analysis, while basic and approximate, suggests that the winning streaks found in top players’ online blitz games on Chess.com are not statistically improbable. Despite the rudimentary nature of my methods, the key takeaway is that the occurrences highlighted by Vladimir Kramnik do not seem to be extraordinarily rare, even with this possibly optimistic approach.
While I respect Kramnik’s efforts to shed light on the prevalence of online cheating, the specific insinuation regarding Hikaru Nakamura’s alleged cheating seems quite unlikely. Considering his consistent performance both in over-the-board and online chess, Nakamura’s results appear to be within the realm of possibility.
There’s room for improvement in my analysis. Primarily, it would be interesting to move from a basic Elo-based estimation to a more refined machine learning model trained on Chess.com’s historical data. This isn’t just about verifying the probability of long win streaks but also about understanding how different the outcomes are from the simple Elo model used in this study.
Additionally, fully leveraging Chess.com’s historical data would allow me to simulate the actual game sequences players have experienced this year. Instead of relying on win probabilities against an “average opponent”, using individual game data and opponent ratings should yield more precise results.
Side note§
Even though the simulated probabilities are incredibly high for all events I found, this isn’t conclusive. My method isn’t perfect and the results would drastically change under different assumptions. The key factor is likely the win probability estimation (which is very naive in this study). Simulation appears to be really sensitive to different probabilities and the results would change if I chose a different win probability estimation strategy.
For example, if I use the full Elo win probability formulas from Wismuth
mentioned before, then win_probability(3176, 2736) = 70%. Even though that is
for classical time control, it’s consistent with what I would personally
initially guess before looking at the data. And, with that, simulating 3000
games with win probability of 70% in each of them would give 0% chance of
accumulating a win streak of 55 games. This isn’t as clear-cut as the
calculations above suggest. I look forward to improving the probability
estimation with more robust methods such as machine learning.
Another significant issue is that I’m calculating the probabilities by making each player’s rating and their opponents’ rating to be constant throughout the whole simulation. It would be great to change that and reflect actual ratings of each examined player and their opponent in each game.